In this article
Property Analysis Report
Modules > Property Lease Management > Inquiries and reports > Reports > Property analysis report
Use this page to generate a report that shows the analysis information for a property. This report is similar to the Property List Report, but has more detail for the required levels of a category.
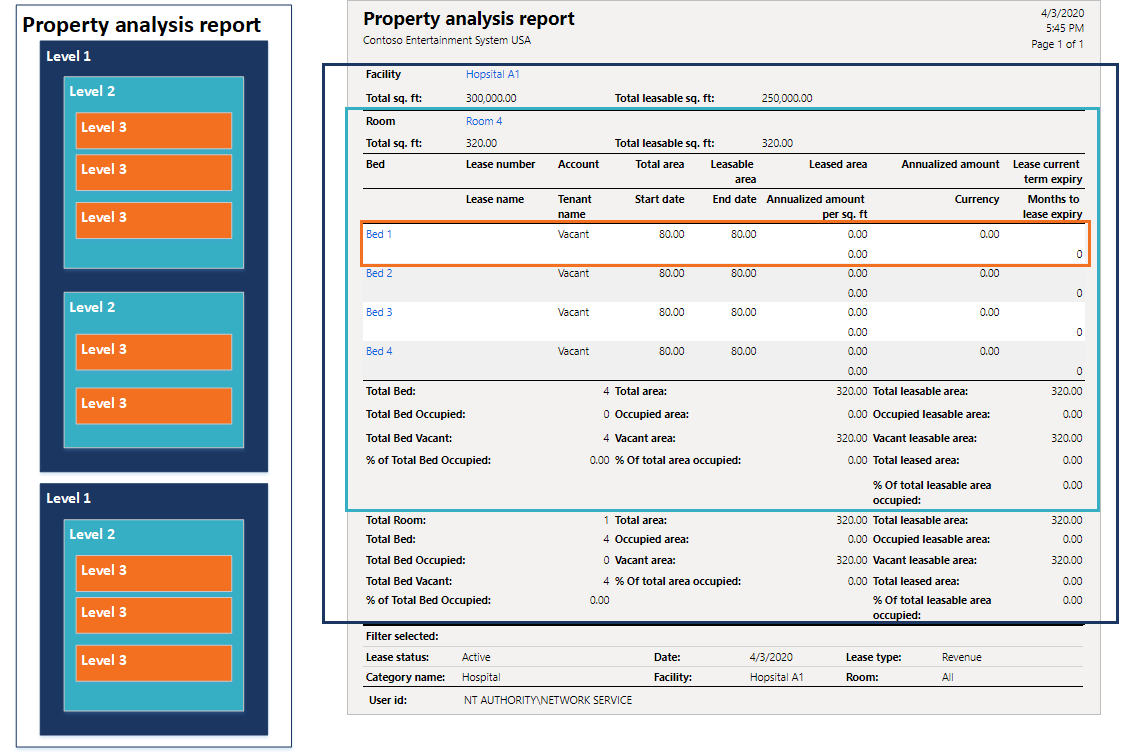
In the following image, you can see how data is organized on the report for a category that has three levels.

Level 3
At this level, the report shows the totals for each Level 3 unit.
If a Level 3 unit is vacant, the Home Owner Account value shows Vacant. All other values are zero, except the Leasable area, which shows the area that can be leased.
If a Level 3 unit is occupied, the following information is available:
- Lease number and name: Displays the lease name and number.
- Account and name: Displays the customer or vendor number.
- Total area: Displays the total area of the level.
- Leasable area: Displays the area that can be leased.
- Start date: Displays the lease start date.
- End date: Displays the lease end date. For active leases, this value is usually empty.
- Leased area: Displays the area that is leased for the lease.
- Annualized amount per area: Displays the amount per square area.
- Annualized amount: Displays the current amount of all charges for the lease for the year.
The sum total of all lines for this level appears as part of a Level 2 total. - Currency: Displays the currency of the lease.
- Lease current term expiry: Displays the end date of the current term of the lease.
- Months to lease expiry: Displays the number of months to the lease expiry based on the specified as-of date.
A level can appear more than once if it is used by more than one lease.
Level 2
At this level, the report shows the sum totals of all lines in Level 3.
- Total area: Displays the total area for Level 2.
- Total leasable area: Displays the total leaseable area for Level 2.
- Total annualized amount: Displays the sum total of the annualized amount for all Level 3 lines.
- Total Level 3: Displays the total number of Level 3 units within this Level 2 unit. This value is based on the actual levels and not the lines in the report. For example, if a line for a Level 3 appears twice, that line is counted as one.
- Total Level 3 occupied: Displays the total number of Level 3 units that are occupied.
- Total Level 3 vacant: Displays the total number of Level 3 units that are vacant.
- Total area: Displays the sum of the total area amount for all Level 3 units.
- Occupied area: Displays the sum of the total area amount for only the Level 3 units that are occupied.
- Vacant area: Displays the sum of the total area amount for only the Level 3 units that are vacant.
- Total leasable area:
- % of total occupied leasable area: Displays the percentage of the total Level 3 units that are occupied. Calculated as follows: total Level 3 occupied / (total Level 3 occupied + total Level 3 vacant).
- % of total vacant leasable area: Displays the percentage of the total Level 3 units that are vacant. Calculated as follows: total Level 3 vacant / (total Level 3 occupied + total Level 3 vacant).
- Total leased area: Displays the sum total of the leased area from lines in Level 3.
- % of total leasable area occupied: Displays the percent of the total leased area. Calculated as follows: total leased area / total leasable area.
Level 1
At this level, the report shows the sum totals of all lines in Level 2 and Level 3. Where totals for level 3 are displayed, the individual total is the sum of all Level 3 units from all Level 2 buildings.
- Total area: Displays the total area for Level 1.
- Total leasable area: Displays the total leaseable area for Level 1.
- Total Level 2: Displays the total number of Level 2 buildings within this Level 1 unit.
- Total Level 3: Displays the total number of all Level 3 units from all Level 2 buildings within this Level 1 unit. If a line for a Level 3 appears twice, that line is counted as one.
- Total Level 3 occupied: Displays the total number of Level 3 units from all Level 2 buildings that are occupied.
- Total Level 3 vacant: Displays the total number of Level 3 units from all Level 2 buildings that are vacant.
- % of total Level 3 occupied: Displays the total number of Level 3 units from all Level 2 buildings that are occupied as a percent. This values is calculated as follows: total Level 3 occupied / (total Level 3 occupied + total Level 3 vacant).
- Total area: Displays the sum of the total area amount for all Level 2 buildings.
- Occupied area: Displays the sum of the occupied area amounts from all Level 2 buildings.
- Vacant area: Displays the sum of the vacant area amounts from all Level 2 buildings.
- % of total area occupied: Displays the sum of the occupied area amounts from all Level 2 buildings as a percent.
- Total leasable area: Displays the sum of the total leasable area amounts from all Level 2 buildings.
- Occupied leasable area: Displays the sum of the occupied leasable area amounts from all Level 2 buildings.
- Vacant leasable area: Displays the sum of the vacant leasable area amounts from all Level 2 buildings.
- Total leased area: Displays the sum total of the leased area from all Level 2 buildings.
- % of total leasable area occupied: Displays the percent of the total leased area. Calculated as follows: total leased area / total leasable area.
Generate Report
To generate a property analysis report, follow these steps:
- In Parameters, specify the Options and Levels.
- In Destination, select where you want the generated report to be sent.
- In Run in the background, specify the settings for running the report in the background.
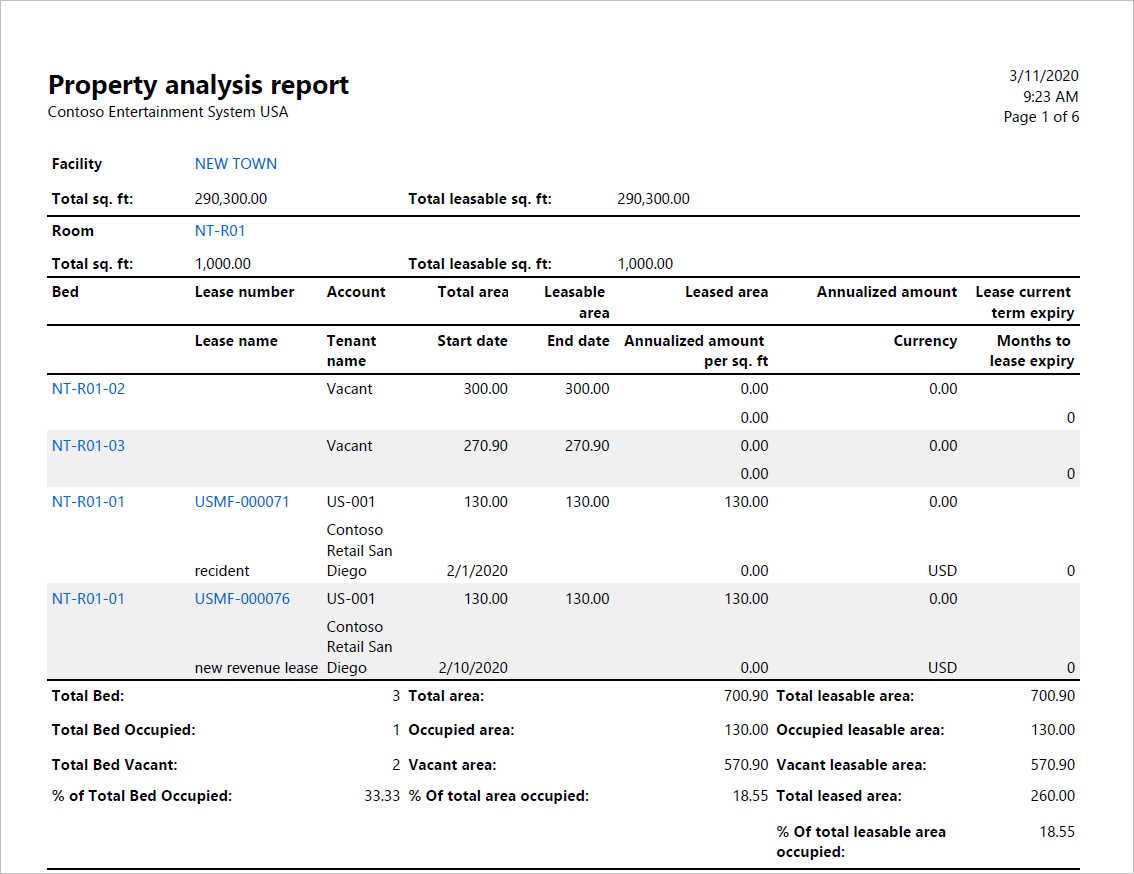
- Select OK, which generates the report and sends it to the selected destination. The following image is an example of the report.

Fields
This page contains the following fields:
| Field | Description |
| Parameters | |
| Options |
Select the options you want:
Specify the lease type that you want to appear in the inquiry list or report: Specify the as of date for which you want to include the records. The default date is the current date. Also, if this value is empty, the current date is used. Select the status of the leases that you want to appear in the inquiry list or report: |
| Levels | |
| Levels | Select the Category name and Levels that you want to appear on the report. |
| Destination | |
| Select the destination for where the report is to be sent: to the screen, a file (Microsoft Excel or PDF), or directly to a printer. | |
| Records to include | |
| Specify the records that you want to include. | |
| Run in the background | |
| Specify the parameters for when the report runs as a background process. | |
| Batch processing |
Select whether to run the report as part of a batch job:
|
| Task description | Specify a description for the task. |
| Batch group | Select the batch in which the report is to run. |
| Private |
Select whether the report is a private report:
|
| Critical job |
Select whether the report run is critical:
|
| Monitoring category | Select the monitoring category for running the report. |